
As someone passionate about data visualization, I decided to work on my interest into a small home-lab project: building a COVID-19 data visualization dashboard. The goal? To create a real-time, visually engaging display of Malaysia’s COVID-19 statistics using open data from the Ministry of Health Malaysia (MOH).
Architecture
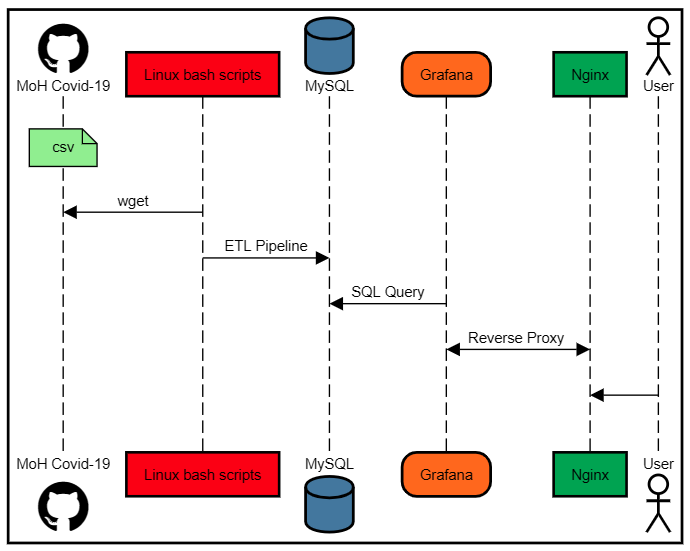
| Component | Role |
|---|---|
| Grafana | Front-end visualization dashboard |
| MySQL | Stores structured COVID-19 datasets |
| NGINX | Web server/reverse proxy for Grafana |
| Bash + Cron | Fetches and ingests latest GitHub data |
Data Source: MOH Malaysia GitHub
MOH Malaysia has done an excellent job publishing detailed COVID-19 data in CSV format on their [GitHub repository](https://github.com/MoH-Malaysia/covid19-public). It includes daily case numbers, hospital utilization, deaths, and vaccination stats—granular data broken down by state.
#List of CSV Files Used:
cases_malaysia.csv
cases_state.csv
vax_malaysia.csv
vax_state.csv
hospital.csv
icu.csv
deaths.csv
deaths_state.csv
population.csv
These files are updated regularly and are perfect for automation.
MySQL Database Setup
To store the data efficiently and make it queryable for Grafana, I created several MySQL tables mirroring the structure of the CSV files.
#Table Schema for cases in Malaysia: my_covid_cases
CREATE TABLE my_covid_cases(
id INT NOT NULL AUTO_INCREMENT,
date DATETIME NOT NULL,
cases_new INT NOT NULL,
cases_import INT NOT NULL,
cases_recovered INT NOT NULL,
cases_active INT NOT NULL,
cases_cluster INT NOT NULL,
cases_unvax INT NOT NULL,
cases_pvax INT NOT NULL,
cases_fvax INT NOT NULL,
cases_boost INT NOT NULL,
cases_child INT NOT NULL,
cases_adolescent INT NOT NULL,
cases_adult INT NOT NULL,
cases_elderly INT NOT NULL,
cases_0_4 INT NOT NULL,
cases_5_11 INT NOT NULL,
cases_12_17 INT NOT NULL,
cases_18_29 INT NOT NULL,
cases_30_39 INT NOT NULL,
cases_40_49 INT NOT NULL,
cases_50_59 INT NOT NULL,
cases_60_69 INT NOT NULL,
cases_70_79 INT NOT NULL,
cases_80 INT NOT NULL,
cluster_import INT NULL,
cluster_religious INT NULL,
cluster_community INT NULL,
cluster_highRisk INT NULL,
cluster_education INT NULL,
cluster_detentionCentre INT NULL,
cluster_workplace INT NULL,
c_time DATETIME NOT NULL DEFAULT NOW(),
PRIMARY KEY (id)
);
A Bash script parses the CSV file and inserts only the latest data into MySQL. I run this via a cron job once a day to keep the data fresh.
Automating Data Extraction
A shell script automates the process:
#!/bin/bash

rootdir="/opt/covid19_MY"
covid_moh_git="https://raw.githubusercontent.com/MoH-Malaysia/covid19-public/main/epidemic/cases_malaysia.csv"
my_covid_file="cases_malaysia.csv"
wget=$(which wget)
db_name="covid19_MY"
table_name="my_covid_cases"
db_user="gadmin"
datafile=/var/lib/mysql-files/cases_malaysia_load.csv
countfile="my_cnt.txt"
extra=/etc/mysql_grafana.cnf

# Get record count
function getcount() {
cd $rootdir/log
mysql --defaults-extra-file=/etc/mysql_grafana.cnf -N << EOF > $countfile
use covid19_MY
select count(*) from my_covid_cases
EOF
echo "1.Current Record Count: $(cat $countfile)"
}

# Cleanup
function cleanup() {
cd $rootdir/data
if [[ -f $my_covid_file ]]; then
rm -f $my_covid_file
echo "2. Remove existing datafile - Completed"
fi
}

# Get the file
function get_file() {
$wget $covid_moh_git 2>/dev/null
echo "3. Download latest datafile from MoH Git Hub - Completed"
}

# Prepare to update new data
function new_data {
cd $rootdir/log
rcount=`cat $countfile`
if [[ $rcount -gt 0 ]]; then
rcount2=(`expr $rcount + 1`)
rcount3="2,$rcount2"
sed "$rcount3"'d' $rootdir/data/$my_covid_file > $datafile
echo "4. Updated Record Count: $(wc -l < $countfile)"
else
cd $rootdir/data
echo "No Data"
cat $my_covid_file > $datafile
fi
}

# Load into database
function load_db() {
mysql --defaults-extra-file=$extra -e "use $db_name" -e "
LOAD DATA INFILE '$datafile'
INTO TABLE $table_name
FIELDS TERMINATED BY ','
OPTIONALLY ENCLOSED BY '\"'
IGNORE 1 LINES
(date,cases_new,cases_import,cases_recovered,cases_active,@cases_cluster,cases_unvax,@cases_pvax,@cases_fvax,cases_boost,@cases_child,@cases_adolescent,@cases_adult,@cases_elderly,cases_0_4,cases_5_11,cases_12_17,cases_18_29,cases_30_39,cases_40_49,cases_50_59,cases_60_69,cases_70_79,cases_80,@cluster_import,@cluster_religious,@cluster_community,@cluster_highRisk,@cluster_education,@cluster_detentionCentre,@cluster_workplace)
set
cases_cluster = NULLIF(@cases_cluster,''),
cases_pvax = NULLIF(@cases_pvax,''),
cases_fvax = NULLIF(@cases_fvax,''),
cases_child = NULLIF(@cases_child,''),
cases_adolescent = NULLIF(@cases_adolescent,''),
cases_adult = NULLIF(@cases_adult,''),
cases_elderly = NULLIF(@cases_elderly,''),
cluster_import = NULLIF(@cluster_import,''),
cluster_religious = NULLIF(@cluster_religious,''),
cluster_community = NULLIF(@cluster_community,''),
cluster_highRisk = NULLIF(@cluster_highRisk,''),
cluster_education = NULLIF(@cluster_education,''),
cluster_detentionCentre = NULLIF(@cluster_detentionCentre,''),
cluster_workplace = NULLIF(@cluster_workplace,''),
c_time = now();"
echo "5. Update New Record/s to Database - Completed"
}

# MAIN #
getcount
cleanup
get_file
new_data
load_db
Then scheduled the execution with a cron job:
0 6 * * * /opt/covid19_MY/cases.sh
Grafana Visualization
Grafana connects seamlessly to MySQL using the built-in data source plugin. Once connected, I created multiple dashboards to track:
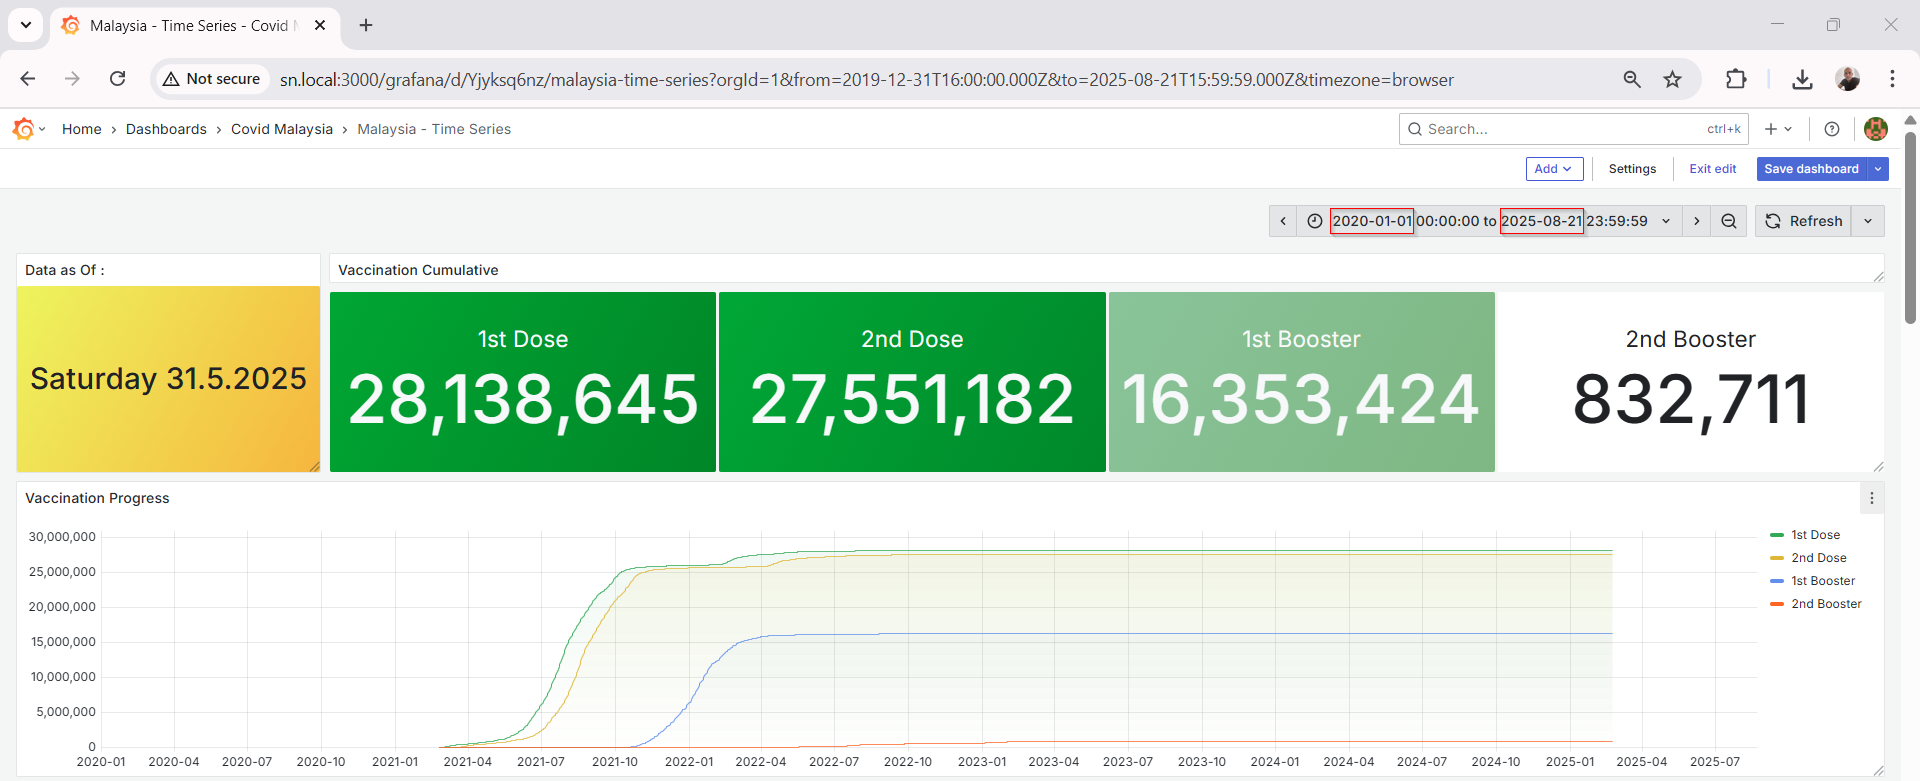
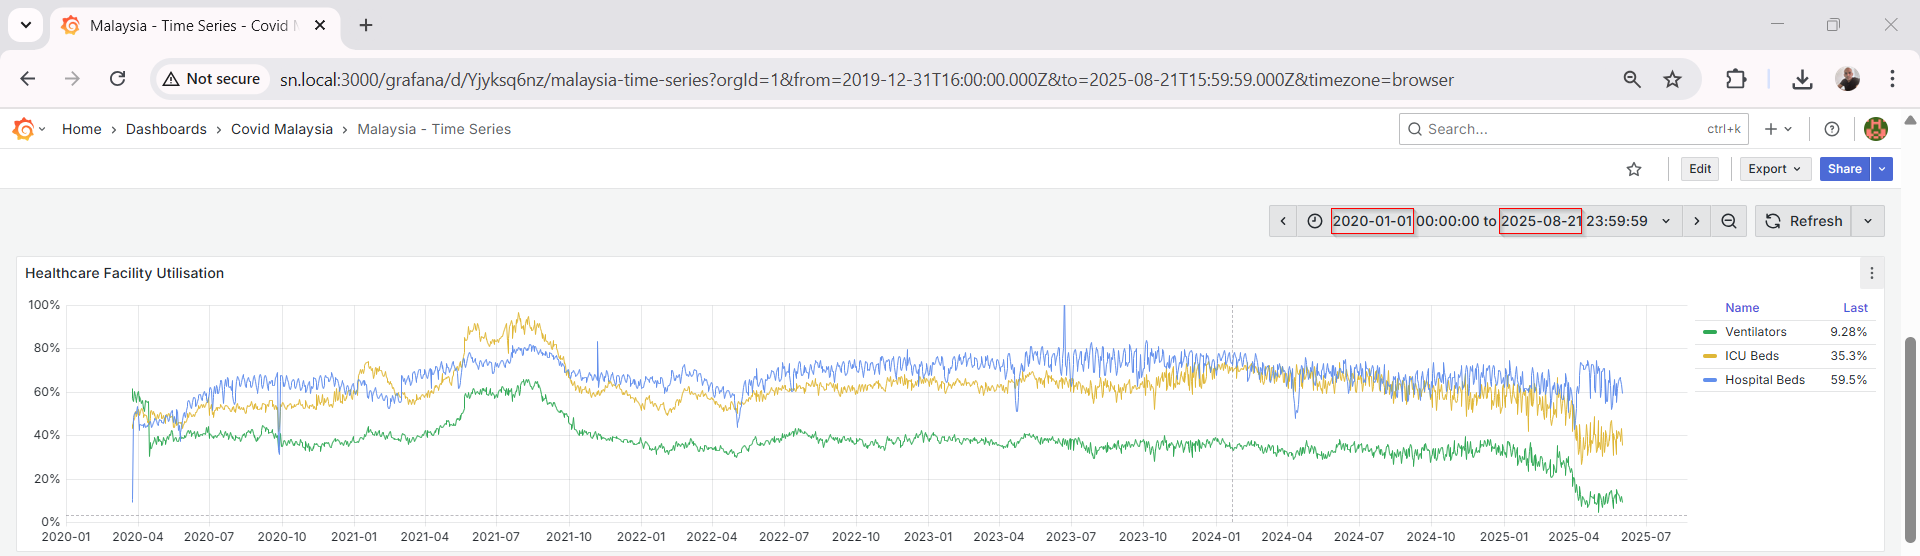
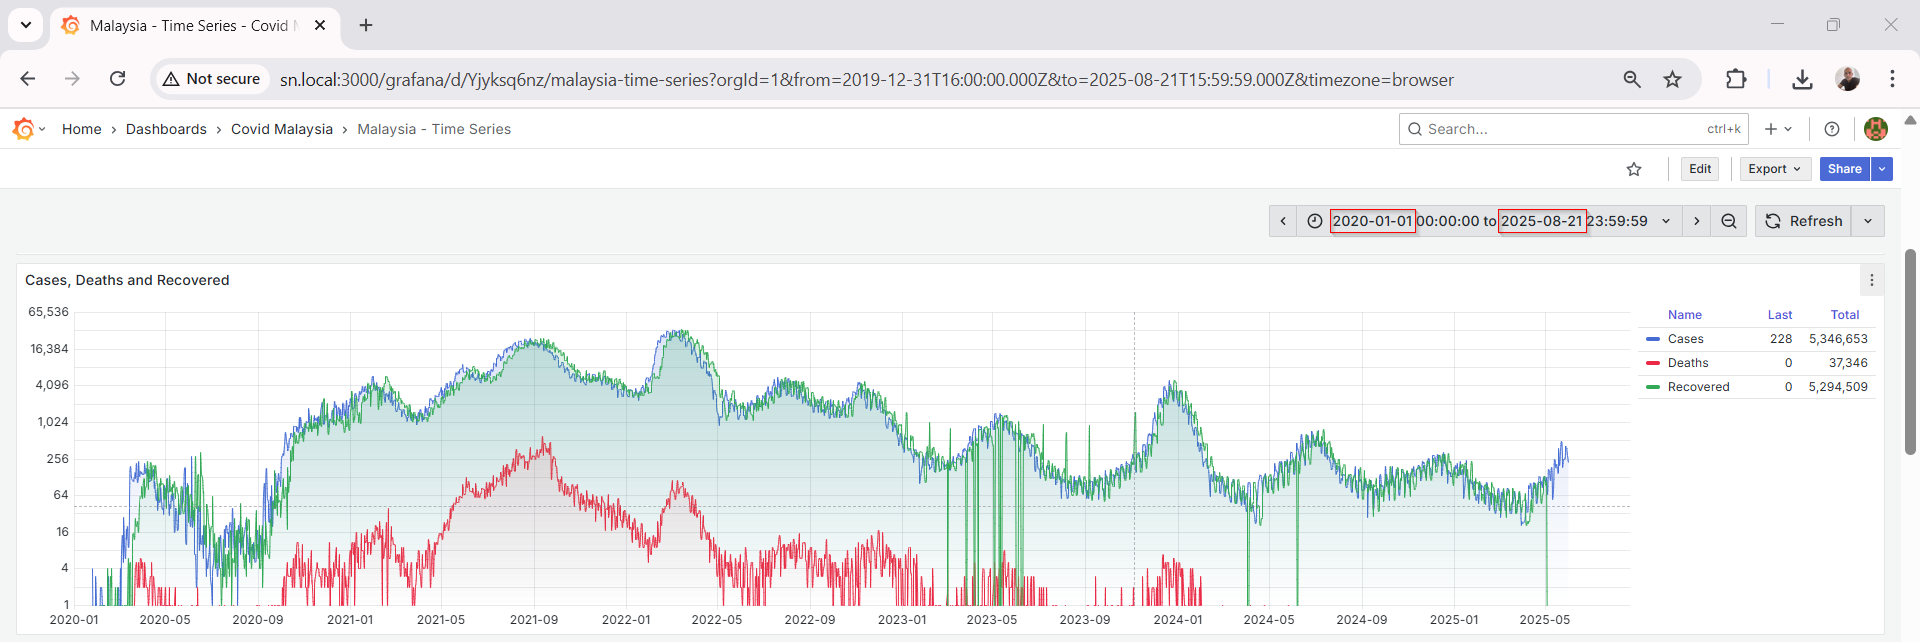
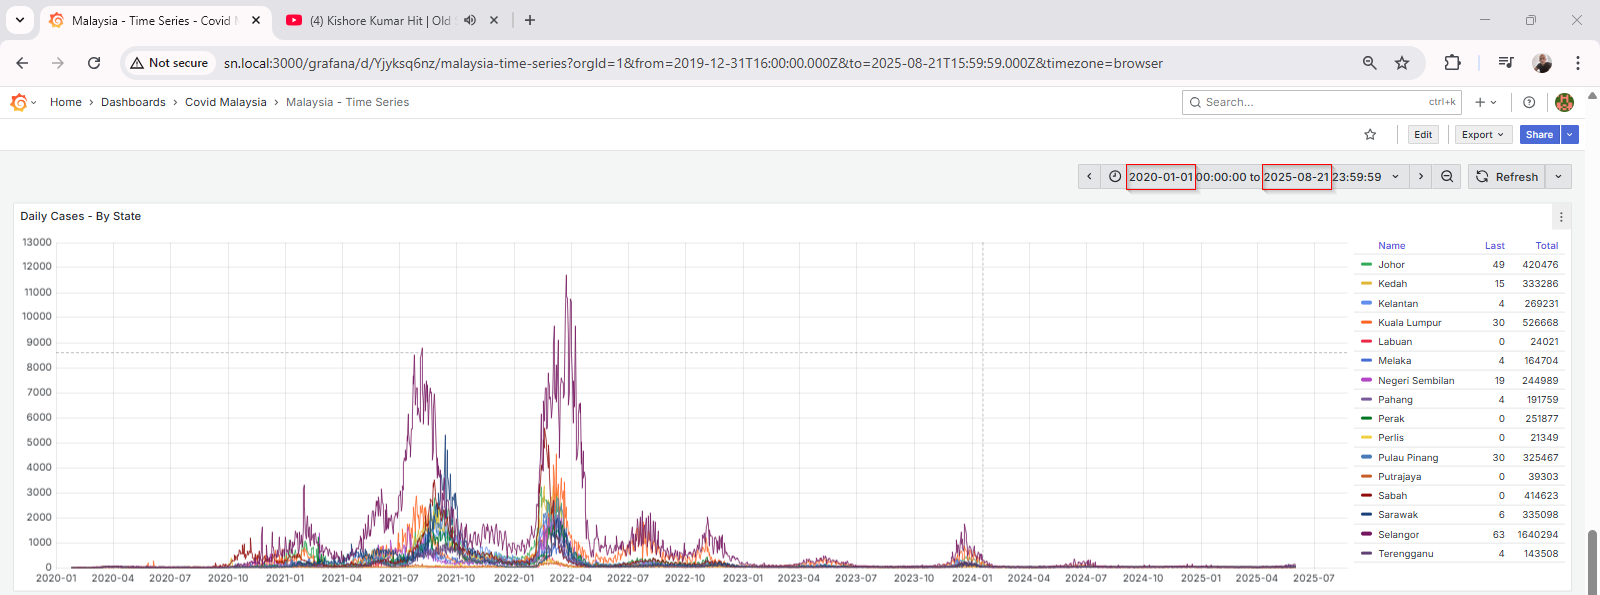
Grafana’s visualization tools make it easy to apply transformations, rolling averages, thresholds, and annotations.
Serving with NGINX
To make the dashboard accessible from my home network, I used NGINX as a reverse proxy in front of Grafana. Here's a basic server block:
server {
  listen 80;
  listen [::]:80 ipv6only=on;
  server_name sn.local;
  root /usr/share/nginx/html;
  index index.html index.htm;

  location /grafana/ {
    proxy_pass http://localhost:3000/;
    proxy_set_header Host $host;
    proxy_set_header X-Real-IP $remote_addr;
    proxy_set_header X-Forwarded-Host $host;
    proxy_set_header X-Forwarded-Server $host;
    proxy_set_header X-Forwarded-For $proxy_add_x_forwarded_for;
  }
}
This lets me access the dashboard via `http://sn.local/grafana` from any device in the network.
Security Considerations
Since this is a home lab project, access is restricted to my local network. However, for those exposing this externally, I strongly recommend:
Using HTTPS
Enabling Grafana authentication
Regular database backups
Rate limiting with NGINX
This project has been a great learning experience—working with real-world data, automating ETL (extract-transform-load) pipelines, and building visual dashboards all within a self-hosted environment. It also keeps me informed with local COVID-19 trends in a way that’s both interactive and informative.
If you’re into data or home labs, I highly recommend trying something similar. With open data and tools like Grafana, the possibilities are endless.